
← Back to Blog
Market Trends
What Has Happened to Home Prices in Oxnard CA Over the Past Year Compared to Where They Are Now in September 2026
By Dian Hernandez
September 26, 2026 · 11 min read
If you have been wondering what has happened to home prices in Oxnard CA over the past year compared to where they are now in September 2026, the short answer is that prices climbed steadily, held firm through spring, and are now sitting at levels that matter whether you are buying, selling, or deciding whether to stay put. This article breaks down the numbers, the forces behind the movement, and what the current market means for your next move.
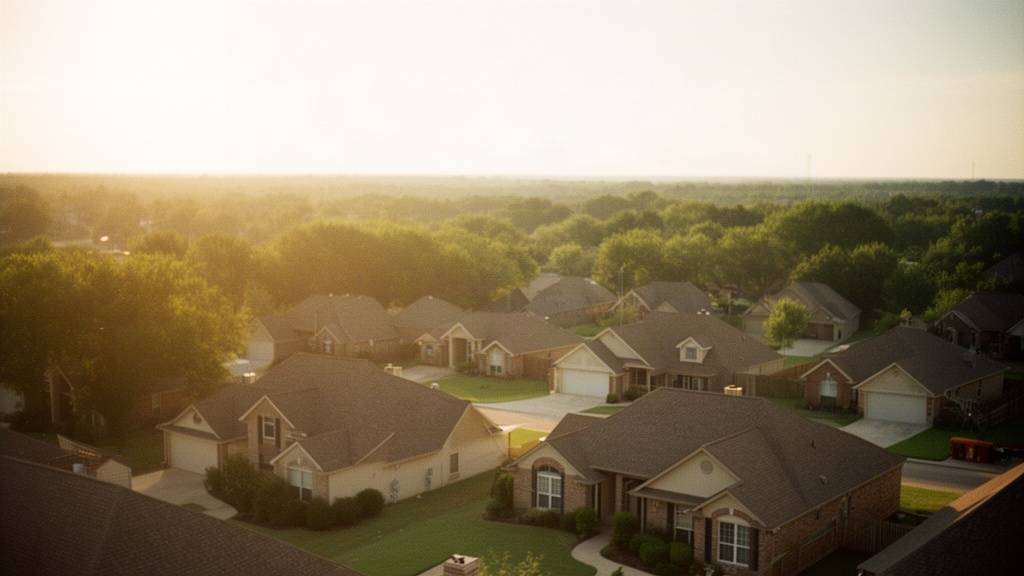
1. Where Oxnard Home Prices Stood a Year Ago
One year ago, in September 2025, the Oxnard housing market was already expensive by most California coastal standards outside of Los Angeles proper. The median home sale price in Oxnard was tracking in the low-to-mid $700,000 range, with single-family detached homes in established inland neighborhoods such as Oxnard Shores adjacent streets and the College Park area pulling between $650,000 and $800,000 depending on condition and lot size.
The Baseline: September 2025 Numbers
Condominiums and townhomes in Oxnard were generally priced between $450,000 and $650,000 in September 2025, with waterfront-adjacent units in the Mandalay Bay and Seabridge communities commanding premiums well above that floor. Price per square foot for a standard single-family home was hovering around $430 to $470, and homes were typically spending 20 to 35 days on market before going under contract.
Inventory at that point was tight but not historically extreme. Oxnard was carrying roughly 1.5 to 2 months of supply across all price bands, which placed it firmly in seller's market territory. Buyers who wanted a move-in-ready home near the beach or close to the Oxnard Transportation Center for Metrolink access were competing with multiple offers on well-priced listings.
What Was Driving the Market Then
Several forces were keeping Oxnard prices elevated in late 2025. Mortgage rates had eased modestly from their 2023 and 2024 peaks but were still in the mid-to-upper 6% range for a 30-year fixed loan, which kept some move-up buyers locked in place and reduced the number of homes coming to market. At the same time, demand from Los Angeles County buyers priced out of Malibu and Santa Monica corridors continued to push into Ventura County, with Oxnard's Pacific Coast Highway frontage and Channel Islands Harbor acting as anchors for that migration.
The agricultural and port economy that has long defined Oxnard also contributed stability. Unlike markets tied entirely to tech or finance employment, Oxnard's economic base includes the Port of Hueneme, the naval base at Point Mugu, food processing and distribution operations, and a growing healthcare sector, all of which provided steady local employment that supported housing demand even when broader economic signals were mixed.
2. How Home Prices in Oxnard CA Changed Month by Month
Tracking what has happened to home prices in Oxnard CA over the past year requires looking at the arc of change, not just the endpoints. The market did not move in a straight line from September 2025 to September 2026.
Fall and Winter 2025 to 2026
October through December 2025 brought the seasonal slowdown that Oxnard typically sees each year. Fewer listings came to market, fewer buyers were actively touring homes, and median prices dipped slightly, landing in the high $680,000s by December.
That winter softening was not a sign of a market in trouble. It was a predictable seasonal pattern that Oxnard has shown consistently over the past decade. Days on market stretched to 35 to 45 days for properties that were not priced sharply, but well-conditioned homes in the $600,000 to $750,000 range continued to attract serious buyers who were taking advantage of reduced competition. January and February 2026 saw prices hold relatively flat as buyers waited for spring inventory to open up.
Spring 2026 Surge
March through May 2026 produced the most notable price movement of the twelve-month period. As new listings came to market and buyer activity accelerated, the median sale price in Oxnard climbed from the high $680,000s to approximately $730,000 to $750,000 by late spring. Homes in the Riverpark planned community, which offers newer construction from the mid-2010s with larger floor plans and proximity to the 101 freeway, were particularly active during this window.
Multiple-offer situations returned in force during April and May 2026. Buyers who had been waiting on the sidelines through winter found themselves competing again, particularly for single-family homes under $800,000 that offered three or more bedrooms and a garage. The combination of pent-up demand, a modest improvement in mortgage rates, and limited new inventory pushed sale prices above list price on a meaningful share of transactions.
Summer Plateau
June through August 2026 brought a plateau rather than a continued climb. Prices stabilized in the $730,000 to $760,000 range for the median single-family home in Oxnard. Days on market edged back up slightly, averaging 28 to 38 days depending on neighborhood and price point. This stabilization is consistent with what Oxnard typically experiences once the spring rush absorbs the pent-up demand: the market does not collapse, but it also stops accelerating.
For context on how these trends fit into the broader 2026 picture, Houzeo's Oxnard housing market data tracks median prices and days on market month by month and is a useful reference for buyers and sellers who want to verify these figures independently.
3. Where Oxnard Home Prices Are Right Now in September 2026
As of September 2026, the Oxnard housing market is holding at elevated prices with modest inventory and steady, if not feverish, buyer activity. The median sale price for a single-family home is currently in the $740,000 to $770,000 range, representing a year-over-year increase of approximately 7 to 10 percent from September 2025.
Current Median and Price Per Square Foot
Price per square foot for detached single-family homes in Oxnard is currently running between $460 and $510, depending on the age of the home, its proximity to the coast, and whether it has been updated. Older ranch-style homes built in the 1960s and 1970s in the central Oxnard grid, particularly in the area between Saviers Road and Rice Avenue, tend to come in at the lower end of that range. Newer or remodeled homes near the beach, Channel Islands Harbor, or in Riverpark push toward the upper end.
For a more detailed look at how these price dynamics fit into the broader question of whether this is a buyer's or seller's market right now, the article on whether it is currently a buyers or sellers market in Oxnard California in September 2026 goes deeper into supply and demand conditions.
How Different Home Types Are Priced
Condominiums and townhomes currently sit in the $480,000 to $680,000 range for most of Oxnard, with the widest spread driven by waterfront access. A standard two-bedroom condo in a non-waterfront complex might list at $490,000 to $530,000. A comparable unit with a boat slip at Mandalay Bay or Seabridge can reach $750,000 to $900,000 or more, depending on slip size and view. The Seabridge community in particular has seen consistent price support from buyers who prioritize the gated waterfront lifestyle and the short drive to the Oxnard Beach Park and Hollywood Beach.
Multi-unit and investment properties in Oxnard have also appreciated over the past year. Duplexes and small apartment buildings in the central Oxnard area, which attract buyers looking for rental income to offset carrying costs, are currently priced 6 to 9 percent above where they were in September 2025. Rent levels in the area have remained firm, which has kept cap rates relatively stable even as purchase prices moved up.
How Oxnard Compares Within Ventura County
Within Ventura County, Oxnard sits at a distinct price point. Camarillo and Thousand Oaks have historically carried higher median prices for detached homes, while Port Hueneme, which borders Oxnard to the south along the coast, generally comes in lower. Oxnard's median in September 2026 puts it in the middle of the county range, which is notable given that it offers direct Pacific Ocean beach access, a working harbor, and proximity to the 101 freeway corridor that most inland Ventura County cities do not provide.
4. What Is Driving Oxnard Home Prices in September 2026
Understanding what has happened to home prices in Oxnard CA over the past year requires looking at the structural forces behind the numbers, not just the numbers themselves. Three factors are doing the most work right now.
Inventory Constraints Along the Coast
Oxnard is geographically constrained in ways that permanently limit supply. The Pacific Ocean sits to the west, the Santa Clara River and agricultural preserve land border the city to the north and east, and Port Hueneme sits immediately to the south. There is no direction in which Oxnard can sprawl indefinitely. That physical boundary means that the housing stock is largely fixed, and every new buyer who wants to live near the beach or the harbor must compete for a limited pool of existing homes.
Active listings in September 2026 are running at roughly 1.8 to 2.2 months of supply across all property types, which remains below the 3 to 4 months that would indicate a balanced market. That persistent undersupply is the single biggest structural reason prices have not pulled back meaningfully even as mortgage rates have stayed elevated.
Interest Rate Effects on Buyer Demand
Mortgage rates in September 2026 are in the mid-6% range for a 30-year fixed loan, which is meaningfully lower than the peaks seen in 2023 but still high enough to affect monthly payment calculations significantly. At a $750,000 purchase price with 20 percent down, a 6.5% rate produces a principal and interest payment of approximately $3,792 per month before taxes and insurance. That payment reality has kept some first-time buyers stretching their timelines or looking at lower price points.
At the same time, buyers who locked in low rates on their current homes in 2020 and 2021 are still reluctant to sell and take on a higher rate on their next purchase. This "rate lock" effect continues to suppress the number of move-up sellers bringing homes to market, which keeps inventory tight and prices supported from below.
New Construction and Its Limits
New construction activity in Oxnard has not been large enough to meaningfully relieve price pressure. The Riverpark community, which delivered the bulk of Oxnard's newer single-family inventory over the past decade, is largely built out. Infill development and smaller projects continue, but the volume is not sufficient to shift the supply-demand balance at the city-wide level. Buyers interested in new construction options currently face limited choices and pricing that often meets or exceeds the resale market.
For a thorough look at the new construction landscape specifically, the guide on buying a new construction home in Oxnard California covers the process, costs, and timeline in detail.
5. What This Price History Means for Buyers and Sellers Right Now
Knowing what has happened to home prices in Oxnard CA over the past year is only useful if it informs a decision. Here is what the data means in practical terms for the two groups most likely reading this.
Guidance for Buyers Entering the Market
Buyers in September 2026 are not walking into a frenzied market, but they are not walking into a buyer's market either. The window between the spring surge and the upcoming fall slowdown is historically one of the more balanced moments to buy in Oxnard. Competition has eased slightly from the April and May peaks, and some sellers are more willing to negotiate on price or terms than they were six months ago.
Buyers should understand that the year-over-year price appreciation of 7 to 10 percent means that waiting another twelve months carries real cost if prices continue on the same trajectory. A home priced at $750,000 today would reach approximately $810,000 to $825,000 at the same rate of appreciation by September 2027. That is not a prediction, but it is context worth having when evaluating whether to act now or wait.
Buyers should also account for the full cost of purchasing, including closing costs, which in Oxnard typically add 1 to 3 percent to the purchase price for buyers. The article on typical closing costs for buying a home in Oxnard California breaks those numbers down so there are no surprises at the table.
Guidance for Sellers Pricing Their Home
Sellers who purchased before 2022 are sitting on substantial equity gains. A home bought in 2019 for $550,000 in Oxnard has likely appreciated to the $720,000 to $780,000 range today, representing $170,000 to $230,000 in equity growth before any improvements. That equity position gives sellers meaningful flexibility.
The critical pricing lesson from the past twelve months is that overpriced homes sat. The homes that attracted offers quickly and sold at or above asking were the ones priced accurately from day one, not the ones that started high and chased the market down with reductions. September 2026 buyers are informed and have access to the same market data sellers do. Accurate pricing is not leaving money on the table; it is the strategy that produces the best outcome.
For a detailed look at how to price and prepare a home for sale in the current Oxnard market, the guide on selling a home in Oxnard California: pricing, timeline and what to expect covers the full process from list to close.
For additional reporting on how analysts are reading the Oxnard price trajectory, this overview of what is happening with house prices in Oxnard in 2026 provides a useful outside perspective on the same data.
FAQ
How much have home prices in Oxnard CA increased over the past year?
From September 2025 to September 2026, the median home sale price in Oxnard increased by approximately 7 to 10 percent, moving from the low-to-mid $700,000 range to approximately $740,000 to $770,000 for a single-family detached home. The increase was not uniform across the year; prices dipped slightly in the winter months before surging during the spring of 2026 and then stabilizing through summer. Condominiums and townhomes followed a similar trajectory but at lower absolute price levels, generally ranging from $480,000 to $680,000 as of September 2026. Waterfront properties in communities like Seabridge and Mandalay Bay maintained their premium positioning throughout the period.
Are home prices in Oxnard expected to keep going up after September 2026?
No one can predict the future of any housing market with certainty, and anyone who tells you otherwise is guessing. What the current data shows is that the structural conditions supporting Oxnard prices, limited land supply, persistent undersupply of homes relative to demand, and steady local employment, have not changed. If those conditions hold and mortgage rates remain in the mid-6% range or improve modestly, prices are more likely to hold or inch upward than to fall significantly. A meaningful price correction would most likely require either a sharp rise in inventory, a significant economic disruption affecting local employment, or a substantial jump in interest rates, none of which are visible in the current data. Buyers and sellers should work with a knowledgeable local agent to evaluate conditions at the specific moment they are ready to act.
What types of homes have appreciated the most in Oxnard over the past year?
Single-family detached homes in the $650,000 to $850,000 price range experienced the most consistent appreciation over the past year in Oxnard, driven by strong demand from both local buyers and those relocating from Los Angeles County. Waterfront condominiums and townhomes in gated communities like Seabridge also held their value well, supported by the relative scarcity of boat-slip properties along the Southern California coast. Older, unrenovated homes in the central Oxnard grid appreciated more modestly, as buyers at those price points were more sensitive to condition and competing with a slightly larger pool of similar inventory. Investment properties such as duplexes appreciated in the 6 to 9 percent range, in line with the broader market, with rent stability helping to keep demand from investors active throughout the year.