
← Back to Blog
Market Trends
Oxnard, California Real Estate Market Guide: Prices, Neighborhoods and Timing — What Other Sources Don't Tell You
By Dian Hernandez
September 27, 2026 · 10 min read
Most online real estate market guides for Oxnard, California recycle the same broad statistics and leave out the details that actually shape a buying or selling decision. This guide goes deeper, covering current prices, the physical character of each major area, and the timing factors that determine whether you pay more or sell faster in this specific coastal Ventura County market.
1. What Makes Oxnard's Market Different From the Rest of Ventura County
Oxnard is not a suburb of Ventura or a satellite of Los Angeles. It is Ventura County's most populous city, with roughly 215,000 residents, its own port, its own agricultural economy, and a coastline that stretches from the Ventura County line south toward Point Mugu. That combination of industrial infrastructure, working waterfront, beach neighborhoods, and a large inland residential grid creates price variation you simply do not see in neighboring Camarillo or Thousand Oaks.
A Coastal City With Inland Price Variation
Within Oxnard's city limits, you can find a detached single-family home in the inland grid for under $700,000 and a waterfront townhome in Seabridge for over $1.2 million. That roughly $500,000 spread within one city is unusual for Ventura County and means that a single median price figure tells only part of the story. Where you are buying within Oxnard matters as much as the city-wide number.
The Role of the Port and Industrial Corridor
The Port of Hueneme and the industrial zone along the south end of the city create a physical boundary that shapes where residential development concentrates. Neighborhoods near the port tend to carry lower price points because of proximity to commercial shipping activity. As you move north and west toward the beach and the marina, prices climb. This geographic logic is one of the first things to understand when reading any Oxnard real estate market guide.
2. Current Home Prices in Oxnard: What the Numbers Actually Mean
As of September 2026, Oxnard's median sale price for single-family detached homes sits in the range of $780,000 to $820,000, depending on the data source and the specific weeks sampled. That figure is up from the $720,000 to $750,000 range recorded in September 2025, reflecting continued appreciation pressure from limited supply. The broader regional context matters here: NAR data showed that home prices increased in 73% of metro areas in the fourth quarter of 2025, and the Oxnard-Thousand Oaks-Ventura metro area was among the markets posting gains during that period. That upward trajectory has continued into 2026.
Median Prices by Housing Type
Breaking the market down by housing type gives a clearer picture than a single median. Single-family detached homes in the inland residential grid, the areas bounded roughly by Gonzales Road to the north, Oxnard Boulevard to the east, and the 101 freeway corridor, typically trade between $650,000 and $780,000 for a three-bedroom home built in the 1960s through 1990s. Coastal single-family homes in Oxnard Shores and Silverstrand run from approximately $950,000 to well over $1.5 million depending on lot size and ocean proximity. Condos and townhomes range from around $450,000 for a smaller inland unit to $900,000 or more for a marina-adjacent property with a boat slip or direct water view.
How Oxnard Compares to the Broader Regional Trend
Oxnard's price appreciation has been steadier than more volatile inland Southern California markets. The coastal buffer tends to insulate values somewhat during broader market corrections, while the city's large inventory of working-class and mid-range housing keeps entry points more accessible than in neighboring Ventura or Santa Barbara County. If you want a more detailed look at how prices have shifted over the past twelve months specifically, the article on what has happened to home prices in Oxnard over the past year breaks that down month by month.
3. Oxnard's Major Areas: Physical Character, Housing Stock and Price Ranges
Understanding Oxnard's neighborhoods means understanding what is physically there, not just what a zip code's median says. Each area has a distinct architectural character, lot configuration, and proximity to amenities that drives its price range independently of city-wide trends.
The Oxnard Shores and Silverstrand Coastal Strip
Oxnard Shores sits directly on the Pacific, with a mix of 1970s beach cottages, remodeled bungalows, and newer two-story homes on narrow lots. Streets run perpendicular to the water, and the lots are typically 25 to 40 feet wide, which means homes are close together but ocean access is a short walk from nearly any address. Silverstrand, just to the south, has a similar character but slightly larger lots and a quieter feel given its position between the beach and the Naval Base Ventura County fence line. Prices in both areas reflect the scarcity of oceanside inventory: a three-bedroom home here rarely lists below $1.1 million, and properties with direct ocean views or beach frontage can exceed $2 million.
Seabridge and the Marina Area
Seabridge is a gated waterfront community built around a network of navigable canals that connect to Channel Islands Harbor. The housing stock consists almost entirely of two and three-story townhomes and detached homes constructed from the late 1990s through the mid-2000s, with private boat docks on many lots. The community has a homeowners association that maintains the common areas and waterways. Prices range from roughly $900,000 for a smaller interior unit to $1.4 million or more for a corner property with a wide water view and a full-size boat slip. Channel Islands Harbor itself, adjacent to the community, has restaurants, a marine supply store, and boat rental operations along its waterfront promenade.
Oxnard's Inland Residential Grid
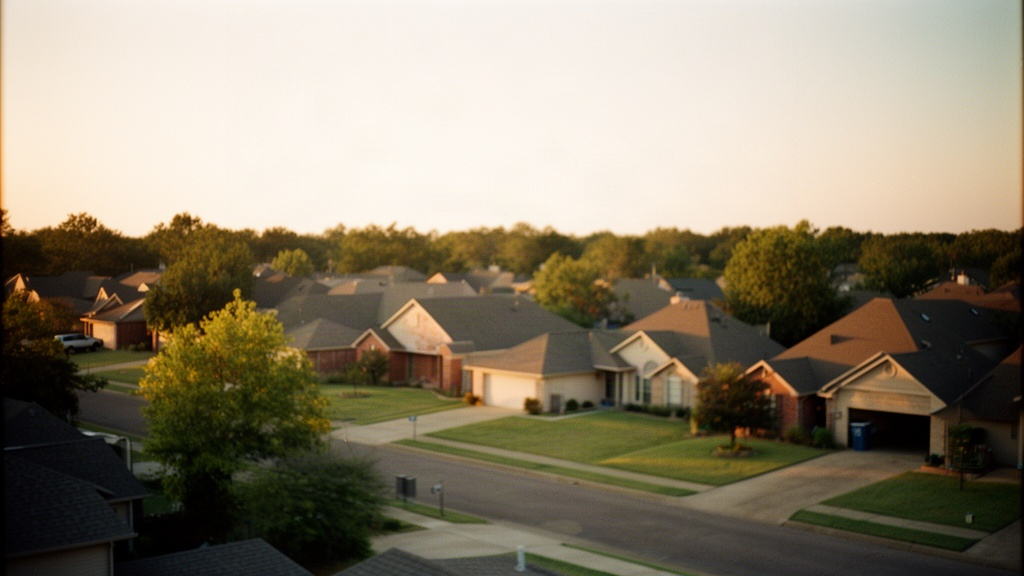
The largest portion of Oxnard's housing stock sits in the inland grid, a broad area of tract homes built primarily between 1955 and 1990. Lot sizes here typically run 6,000 to 8,000 square feet, homes are mostly single-story with attached two-car garages, and the streets are wide and flat. The area around Oxnard College, along Gonzales Road and Victoria Avenue, has a concentration of 1970s and 1980s homes that have been steadily updated. Prices in the inland grid represent the most accessible entry point in the city, with three-bedroom homes regularly listing in the $650,000 to $760,000 range. Proximity to the 101 freeway and the Metrolink station at Rice Avenue makes this area practical for commuters heading toward Los Angeles or Ventura.
Colonia and the Historic Central Neighborhoods
The Colonia neighborhood and the blocks surrounding downtown Oxnard contain some of the city's oldest residential structures, including Craftsman bungalows and Spanish Colonial Revival homes from the 1910s through the 1940s. Lot sizes vary considerably, and the street grid in this area is older and less uniform than the postwar tracts to the north and west. The Carnegie Art Museum and Heritage Square, a collection of restored Victorian-era homes on West Main Street, are within walking distance of this area. Prices here tend to run lower than the inland grid average, with many homes listing in the $580,000 to $700,000 range, though renovated historic properties can push higher.
4. Timing Your Purchase or Sale in Oxnard
Timing in Oxnard follows some of the same seasonal patterns seen across California, but the coastal location adds a layer that inland markets don't have. The city's year-round mild temperatures mean the traditional spring-summer surge is less dramatic here than in markets with cold winters, but it still exists. For a detailed comparison of spring versus fall listing outcomes, the article on spring vs. fall listing timing in Oxnard covers the price and speed differences directly.
Seasonal Patterns Specific to a Coastal Market
Coastal properties in Oxnard Shores and Seabridge see a noticeable uptick in buyer activity from February through June. Buyers who want to be settled in a beach home before summer begin their searches in late winter, which means sellers who list in February or March often face less competition from other listings and more urgency from buyers. The late summer and early fall period, roughly July through September, tends to bring out buyers who missed the spring window and are motivated to close before school calendars shift or year-end work pressures increase. Currently, in September 2026, the market is in that second active window.
Interest Rate Sensitivity in This Price Range
At Oxnard's current price levels, a one-point move in the 30-year fixed mortgage rate translates to roughly $400 to $500 per month in payment difference on a median-priced home. That is a meaningful number for buyers stretching to reach coastal price points. When rates dip even modestly, demand in the $700,000 to $900,000 range tends to spike quickly because buyers who were sitting on the sideline suddenly qualify for the homes they wanted. Sellers in that price band benefit from moving when rate sentiment is favorable, not waiting for a specific calendar month.
When Inventory Tends to Rise and Fall
Oxnard's active listing count typically reaches its annual peak in May and June, then contracts through the summer as homes sell and fewer new listings come on. By October and November, inventory is usually at its lowest point of the year, which historically means less choice for buyers but also less competition for sellers. November through January listings often sit longer, but the buyers who are active during those months tend to be serious and pre-approved rather than casual browsers. Understanding whether it is currently a buyers or sellers market in Oxnard requires looking at active inventory alongside days on market; the article on buyers market vs. sellers market in Oxnard right now covers both metrics for September 2026 specifically.
5. What Buyers and Sellers Consistently Miss About This Market
Generic market guides tend to focus on medians and months of supply. The details that actually affect your transaction in Oxnard are more specific, and they rarely appear in statewide or national summaries.
The Condo and Townhome Layer
Oxnard has a substantial attached-home market that behaves differently from the single-family segment. Condos and townhomes in Oxnard carry HOA fees that typically range from $350 to $650 per month, depending on the community's amenities and the age of its infrastructure. Those fees affect purchasing power directly: a buyer approved for a $750,000 purchase on a single-family home may find their effective budget reduced by $60,000 to $80,000 when HOA fees are factored into the debt-to-income calculation. Communities like Riverpark, in the northeast part of the city near the 101 and Vineyard Avenue interchange, have newer construction townhomes with HOA fees on the higher end of that range but also newer roofs, HVAC systems, and community parks.
New Construction's Effect on Resale Pricing
Active new construction projects in Oxnard, particularly in the Riverpark area and along the former Wagon Wheel site near the 101, create direct competition for resale sellers in the same price range. Buyers comparing a resale 1980s home to a new construction townhome with warranties and modern finishes will factor that comparison into their offers. Resale sellers in the $700,000 to $850,000 range need to price with that competition in mind, especially if their home has deferred maintenance or dated kitchens and baths. The guide on buying new construction in Oxnard explains the builder process in detail, which is useful context even if you ultimately choose a resale home.
What Contingencies Look Like Right Now
In September 2026, most accepted offers in Oxnard still include an inspection contingency and a financing contingency, which is a shift from the stripped-down offers that were common during the peak competition years. Appraisal contingencies are more negotiable, particularly on coastal properties where comparable sales are limited and appraised values can lag behind contract prices. Sellers of well-maintained homes in the $700,000 to $900,000 inland range are seeing offers with fewer concessions than the waterfront segment, where buyers have more negotiating room given the higher price points and smaller buyer pool.
The national context supports Oxnard's continued price stability. NAR reported that three out of four metro areas posted home price increases in the second quarter of 2025, and the Ventura County coastal corridor was among the markets that held firm through that period. That underlying demand, combined with Oxnard's constrained coastal land supply, continues to support values heading into late 2026.
FAQ
What is the current median home price in Oxnard, California?
As of September 2026, the median sale price for a single-family detached home in Oxnard is in the $780,000 to $820,000 range, up from approximately $720,000 to $750,000 in September 2025. That figure varies significantly by area: inland grid homes typically sell in the $650,000 to $780,000 range, while coastal properties in Oxnard Shores or Seabridge routinely exceed $1 million. Condos and townhomes have their own separate range, starting around $450,000 for smaller inland units. Using the city-wide median alone without accounting for location within Oxnard can lead buyers and sellers to misjudge their specific market position.
Is Oxnard a good place to buy real estate compared to other Ventura County cities?
Oxnard offers a wider range of price points than most other Ventura County cities, from entry-level condos under $500,000 to waterfront homes above $1.5 million, all within one city's boundaries. That variety means buyers at different budget levels can find options without leaving the area. The city also has direct Metrolink rail access at the Rice Avenue station, Channel Islands Harbor for recreational boating, and a Pacific coastline that other inland Ventura County cities lack. Whether Oxnard fits your specific needs depends on your priorities around commute, housing type, and budget, which is a personal decision best made by touring the areas and reviewing current listings with a local agent.
When is the best time of year to sell a home in Oxnard?
Oxnard's coastal location means buyer activity stays more consistent year-round than in markets with cold winters, but February through June still tends to produce the strongest competition among buyers and the shortest days on market. Sellers who list in that window typically face more offers and less price negotiation than those who list in November or December. The late summer window, July through September, is a secondary active period when motivated buyers who missed the spring market are still searching. Pricing accurately matters more than the exact calendar month: an overpriced home will sit regardless of season, while a well-priced home in good condition tends to attract offers within the first two to three weeks in any part of the year.