
← Back to Blog
Market Trends
Phoenix, Arizona Real Estate Market Guide: Prices, Neighborhoods and Timing for Buyers, Sellers, and Relocators
By Azucena Reyes Sandoval
September 22, 2026 · 10 min read
If you are buying, selling, or relocating to Phoenix, Arizona, understanding the real estate market before you make a move can save you tens of thousands of dollars and weeks of frustration. This Phoenix, Arizona real estate market guide covers current prices, how different parts of the city are performing, and the timing factors that most directly affect what you pay or what you net. Whether a friend referred you here or you found it on your own, the information below reflects conditions as of September 2026.
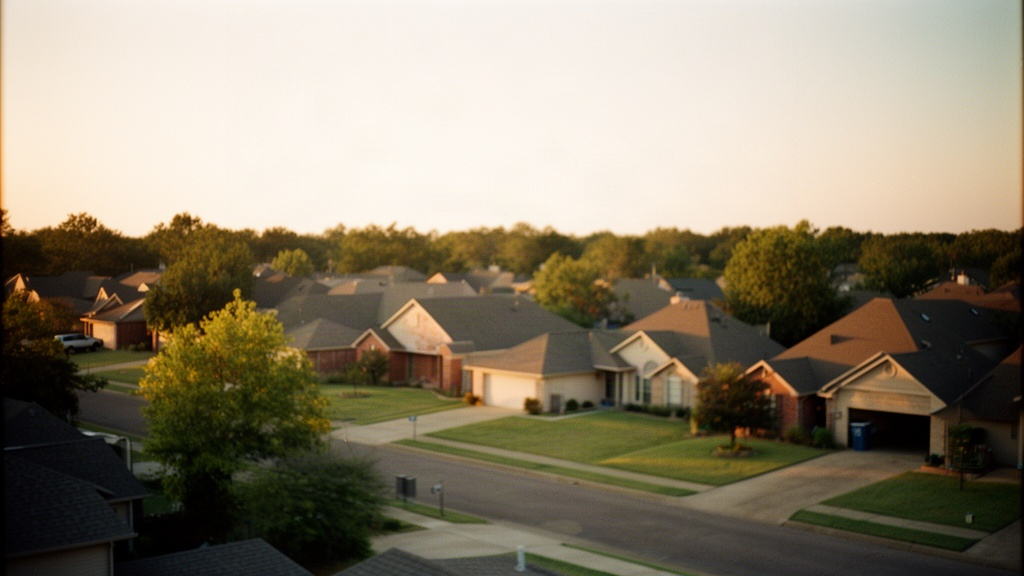
1. What the Phoenix Housing Market Looks Like Right Now
The Phoenix metro is a buyer's market in September 2026. Inventory has climbed steadily since early 2025, giving buyers more choices and more leverage than they had during the peak years of 2021 and 2022. Sellers who price correctly are still closing, but the days of receiving five offers by Sunday night are largely behind us for now.
Median Prices Across the Metro
As of September 2026, the median home price in the city of Phoenix proper sits around $415,000, down modestly from the $440,000 range seen in mid-2024. The broader metro, which includes Scottsdale, Tempe, Gilbert, Chandler, and Glendale, carries a blended median closer to $450,000 when luxury inventory is factored in. Entry-level homes in west Phoenix and parts of south Phoenix can still be found in the $290,000 to $340,000 range, while properties in the Biltmore corridor and north Scottsdale push well past $800,000.
Inventory and Days on Market
Active listings across the Phoenix metro are running roughly 60 to 70 percent higher than they were in September 2023. The average days on market for a single-family home in Phoenix city limits is currently around 38 to 45 days, compared to under 20 days at the height of the seller's market. Condos and townhomes are sitting longer, often 50 to 60 days, particularly in buildings with higher HOA fees.
What the Data Signals for Buyers and Sellers
Price reductions are common right now. Reporting from HousingWire noted that roughly half of Phoenix-area homes were seeing price cuts during the 2025 correction period, and that dynamic has carried into 2026 in many price bands. For buyers, this means negotiating power on both price and seller concessions. For sellers, it means that overpricing at launch is a strategy that backfires quickly in this market.
2. Neighborhood Breakdown: Where Prices Sit Across Phoenix
Phoenix covers more than 500 square miles, so "the Phoenix market" is really a collection of distinct submarkets with very different price points, housing stock, and absorption rates. Understanding those differences is one of the most useful things this real estate market guide can give you.
Central and Urban Core Phoenix
The central corridor, which runs roughly from downtown Phoenix up through Midtown and into the Camelback East and Biltmore areas, contains a wide mix of housing types. You will find 1950s and 1960s ranch homes on lots of 7,000 to 10,000 square feet sitting alongside newer infill townhomes and condominium buildings. Prices in the 85014, 85016, and 85018 zip codes generally range from $500,000 to well over $1.5 million depending on the street, lot size, and whether the home has been updated.
The Arcadia neighborhood, which straddles the Phoenix and Scottsdale border along Thomas Road and Indian School Road, is one of the most recognizable submarkets in the metro. Larger lots, mature citrus trees, and proximity to the Camelback Mountain trail system make it a consistently active area. For a detailed breakdown of that specific pocket, the Arcadia Phoenix real estate market guide covers prices and timing in depth.
North Phoenix and Deer Valley Corridor
North Phoenix, anchored by zip codes like 85027, 85085, and 85086, has seen significant new construction activity through 2025 and into 2026. Master-planned communities such as Norterra, Union Park at Norterra, and the newer phases of Dynamite Mountain Ranch offer homes ranging from $450,000 for a 2,000-square-foot production build to over $750,000 for larger lots with mountain views. The area sits roughly 20 to 30 miles from downtown Phoenix, with Loop 101 and Interstate 17 providing the primary commute routes.
Resale homes in the Deer Valley corridor tend to be priced slightly below comparable new construction, partly because buyers can negotiate more aggressively in the current market. If you are comparing new builds to resale in this part of the city, the article on new construction developments in north Phoenix lays out what is currently being built and what the builder incentive landscape looks like.
West Phoenix and Laveen
West Phoenix and the Laveen area offer some of the most accessible price points in the city. Homes in the 85031, 85033, and 85339 zip codes frequently list between $290,000 and $380,000 for three and four-bedroom single-family homes built between 2000 and 2015. Laveen in particular has seen a wave of newer construction along Dobbins Road and 51st Avenue, with some subdivisions offering homes in the low $400,000s with larger lots than you would find closer to the urban core.
Surrounding Suburbs Worth Knowing
Many buyers who start their search in Phoenix city limits eventually expand to neighboring cities once they understand the price-to-space tradeoff. Chandler, Gilbert, and Tempe each have their own market dynamics. Chandler's median home price currently sits around $480,000 to $510,000, with strong demand in the Price Road Corridor near the Intel and TSMC campuses. Gilbert is running slightly higher in some neighborhoods. For buyers weighing those options, the Chandler real estate market guide and the guide to buying a home in Gilbert offer side-by-side context on what your budget gets you in each city.
3. Timing the Phoenix Market: When to Buy and When to Sell
Timing matters in Phoenix more than in many other metros because of the city's extreme seasonal temperature swings. Those temperature patterns directly influence when homes hit the market, when buyers are most active, and how long listings sit.
Seasonal Patterns in Phoenix
Phoenix's busiest buying season runs from January through April. Snowbirds and out-of-state relocators flood the market during those months, driving up competition and compressing days on market. The summer months, May through August, see a noticeable slowdown as temperatures routinely exceed 110 degrees Fahrenheit. Sellers who list in June or July often face longer sit times and end up reducing their prices. September, where the market sits right now, is a transition month: temperatures are dropping back toward the low 90s, buyers are returning from summer breaks, and inventory is still elevated, which creates a window of real opportunity for buyers.
Rate Environment and Affordability in 2026
Mortgage rates have remained in the 6.5 to 7.2 percent range for most of 2026, keeping monthly payments elevated relative to the pre-2022 era. On a $415,000 purchase with 10 percent down at 6.8 percent, a 30-year fixed payment runs approximately $2,430 per month before taxes and insurance. That math has pushed some buyers toward the outer suburbs or toward new construction where builders are buying down rates as an incentive. The National Association of Realtors had forecast Phoenix as one of the top housing markets for 2025, citing its job growth and population inflow, and those fundamentals have continued to support demand even as affordability has tightened.
How Long Homes Are Sitting
The current average of 38 to 45 days on market for Phoenix single-family homes means buyers have time to be deliberate. You are unlikely to lose a well-priced home because you waited 48 hours to schedule a showing, which was a real risk in 2021 and 2022. However, homes that are freshly listed, priced accurately, and in move-in condition are still moving faster, sometimes within 10 to 14 days. Knowing how to read days on market data for a specific listing is one of the most useful negotiating tools available to buyers right now.
4. What Buyers Need to Know Before Making an Offer in Phoenix
Buying in Phoenix in September 2026 requires a different playbook than buying here three years ago. Leverage has shifted, but so have the costs and complexities involved in closing a deal.
Budgeting Beyond the List Price
Closing costs in Arizona typically run 2 to 3 percent of the purchase price for buyers. On a $415,000 home, that is $8,300 to $12,450 in addition to your down payment. Those costs include lender fees, title insurance, escrow fees, and prepaid items like homeowner's insurance and property tax reserves. In the current market, it is common to negotiate seller concessions toward closing costs, particularly on homes that have been sitting for 30 or more days. If you are a first-time buyer, the first-time home buyer guide for Phoenix breaks down every cost line by line.
Property taxes in Maricopa County are assessed at a primary tax rate that varies by municipality and school district. Phoenix city limits typically carry an effective rate of around 0.6 to 0.8 percent of assessed value annually, which is lower than many comparable metros. On a $415,000 home, annual property taxes often land between $1,200 and $1,800 depending on the specific parcel and any applicable exemptions.
New Construction vs. Resale
New construction in Phoenix currently offers builder incentives that resale sellers cannot match, including rate buydowns, closing cost contributions, and design center credits. The tradeoff is that new builds are concentrated in the outer ring, primarily north Phoenix, Buckeye, Queen Creek, and Surprise, which adds commute time for anyone working in the urban core or in Tempe's employment centers. Resale homes in central Phoenix offer established landscaping, larger lots in many cases, and proximity to places like the Heard Museum, Roosevelt Row, and the Phoenix Art Museum, all of which sit within or near the urban core.
Due Diligence in the Desert
Phoenix's climate creates inspection items that buyers from other parts of the country may not anticipate. Roof condition is critical: flat and low-slope roofs common in older Phoenix homes need to be inspected for membrane integrity, particularly after monsoon season, which runs June through September. HVAC systems work harder here than almost anywhere in the country, so age and condition of the air conditioning unit is a major factor. Stucco exteriors should be checked for cracking and water intrusion, especially around window frames and roof parapets.
5. What Sellers Need to Know to Price and Close Successfully
Selling in Phoenix right now requires a clear-eyed view of where the market actually is, not where it was in 2022. Sellers who anchor to peak prices are watching their listings accumulate days on market while better-priced competitors close.
Pricing Strategy in a Price-Cut Market
The data is clear: homes that price correctly from day one sell faster and closer to list price than homes that start high and reduce. A comparative market analysis based on closed sales from the past 60 to 90 days, not 12 months, is the most reliable pricing tool in a shifting market. In Phoenix right now, that often means pricing 3 to 6 percent below what a similar home sold for in early 2024. Buyers are doing their homework, and an overpriced listing signals either an uninformed seller or one who is not serious about closing.
Preparing Your Home for the Phoenix Buyer Pool
Phoenix buyers in 2026 are spending more time at home than they were pre-pandemic, which means outdoor living spaces carry real weight. A functional covered patio, a well-maintained pool (or a yard that supports one), and updated kitchen and bath finishes are the three areas where pre-listing investment tends to show the strongest return. Cosmetic updates like fresh interior paint in current neutral tones, updated light fixtures, and professional landscaping along the front elevation can meaningfully reduce days on market without requiring a full renovation budget.
Timeline from Listing to Close
In Arizona, the standard purchase contract allows for a 10-day inspection period and a close of escrow typically set 30 to 45 days from contract acceptance. From the moment you list to the day you hand over keys, sellers should plan for 60 to 90 days in the current market if the home is priced accurately. Sellers who need to coordinate a purchase on the other end should discuss bridge financing options or a leaseback arrangement with their agent well before going active on the MLS.
For a detailed walkthrough of the seller's process from start to finish, the guide on selling a home in Phoenix covers every stage including pricing, offers, inspections, and the final walk-through.
FAQ
Is Phoenix a buyer's market or a seller's market in September 2026?
Phoenix is currently a buyer's market as of September 2026. Active inventory is running roughly 60 to 70 percent higher than it was two years ago, and average days on market for single-family homes in the city has stretched to 38 to 45 days. Price reductions are common across most price bands, and buyers are successfully negotiating seller concessions toward closing costs. That said, well-priced, move-in-ready homes in central Phoenix and high-demand corridors like Arcadia and the Biltmore area are still moving faster than the market average.
What is the median home price in Phoenix, Arizona right now?
As of September 2026, the median single-family home price in Phoenix city limits is approximately $415,000, down from around $440,000 in mid-2024. Entry-level homes in west Phoenix and Laveen can be found in the $290,000 to $340,000 range, while the central corridor, Arcadia, and the Biltmore area push median prices to $600,000 and well above. The broader metro median, which includes Scottsdale, Chandler, Gilbert, and Tempe, runs closer to $450,000 when all housing types are included. Prices vary significantly by zip code, lot size, age of the home, and condition.
When is the best time of year to buy or sell a home in Phoenix?
For sellers, the strongest window is typically January through April, when out-of-state relocators and snowbirds are most active and competition among buyers is highest. For buyers, the late summer and early fall window, roughly August through October, tends to offer more inventory, longer days on market, and more motivated sellers who listed during the peak season and have not yet closed. September 2026 falls squarely in that buyer-favorable window. The slowest period for both sides is June through August, when triple-digit heat reduces foot traffic and buyer urgency significantly.