← Back to Blog
Market Trends
San Antonio, Texas Has the Best Customer Reviews Online: Real Estate Market Guide on Prices, Neighborhoods and Timing
By Lisa Reyna
Option One Real Estate
September 20, 2026 · 11 min read
San Antonio, Texas has the best customer reviews online when people research where to buy or sell a home in South Texas, and for good reason: the city offers a wide range of housing stock, price points that span entry-level to luxury, and a market that rewards buyers and sellers who understand its timing. This guide breaks down what the San Antonio real estate market looks like right now in September 2026, which neighborhoods carry the most activity, what prices are doing, and when to make your move.
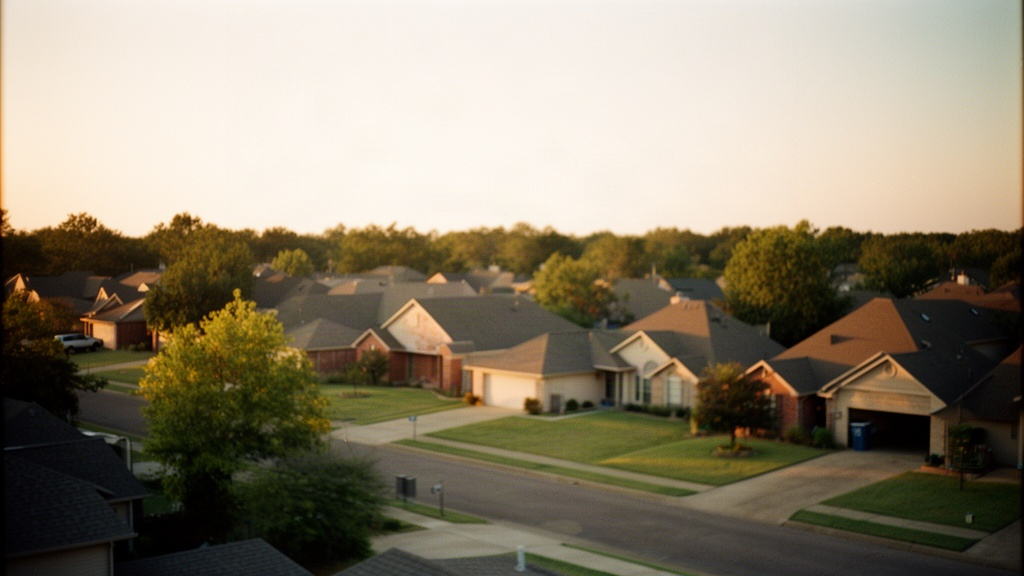
1. What the San Antonio Real Estate Market Looks Like Right Now
The San Antonio market in September 2026 is a study in balance. After several years of sharp appreciation and low inventory, the market has settled into a more measured pace where neither buyers nor sellers hold an overwhelming advantage. Median home prices in the greater San Antonio metro sit in the range of $295,000 to $320,000 depending on the submarket, with the city's inner neighborhoods commanding more and outlying areas offering entry points well below $250,000.
Current Price Ranges
Price ranges across San Antonio vary considerably by ZIP code and property type. Single-family homes in the 78209 ZIP code, which covers Alamo Heights and its surrounding streets, routinely trade between $450,000 and $900,000. Homes in the 78250 and 78251 ZIP codes on the far northwest side often list between $230,000 and $360,000. Condos and townhomes in and around the Pearl District and Southtown start around $275,000 and can exceed $600,000 for newer construction with river views.
Inventory and Days on Market
Inventory has climbed compared to the extremely tight conditions of 2022 and 2023. As of September 2026, the San Antonio metro is carrying roughly three to four months of housing supply in most price bands, which is closer to a balanced market than the sub-one-month supply that defined the pandemic era. Average days on market for a properly priced home runs between 35 and 55 days, though well-presented homes in the $280,000 to $380,000 range still move faster than that.
How San Antonio Compares to the Broader Texas Market
Texas as a whole has seen a notable shift in housing momentum. According to reporting from HousingWire on Texas housing market trends, major Texas metros including San Antonio experienced softening demand and rising inventory through 2025, a trend that has continued into 2026. San Antonio's price corrections have been more modest than Austin's, largely because San Antonio never saw the same degree of speculative run-up. That relative stability is one reason the city continues to attract buyers relocating from higher-cost metros.
2. A Neighborhood-by-Neighborhood Look at San Antonio Housing
San Antonio's housing stock reflects more than 300 years of growth, and each part of the city has a distinct character in terms of architecture, lot size, price, and proximity to employment and amenities. Understanding these differences is essential before making an offer anywhere in the metro. For a deeper look at one of the city's most established enclaves, see the Olmos Park area real estate market guide.
The Inner Loop and Historic Districts
The inner loop encompasses neighborhoods like King William, Lavaca, Monte Vista, and Mahncke Park. These areas feature a mix of late 19th and early 20th century architecture, including Victorian cottages, Craftsman bungalows, and Spanish Colonial Revival homes. Lot sizes tend to be smaller, typically 5,000 to 8,000 square feet, and many properties have been renovated. Prices in King William and Monte Vista frequently range from $400,000 into the low millions for larger historic homes. Proximity to the San Antonio River Walk, the Pearl Brewery complex, and downtown employment centers makes these areas popular with people who prefer walkable, urban-style living.
The Northwest Corridor
The northwest side of San Antonio, stretching along Loop 1604 and US-281 toward Stone Oak and the Medical Center, contains some of the city's highest-volume residential activity. Stone Oak sits in the 78258 ZIP code and features master-planned subdivisions with homes ranging from $380,000 to well over $700,000. The Medical Center corridor, anchored by South Texas Medical Center on Babcock Road, draws buyers who work in healthcare. Homes in that pocket, particularly in neighborhoods like Deerfield and Elm Creek, typically run from $280,000 to $480,000. The area also has substantial retail infrastructure along Loop 410 and Bandera Road.
The Far West Side and Helotes Area
Helotes and the far west side along FM 1560 and Culebra Road offer larger lots and newer construction at prices that often undercut comparable homes closer to the city center. Homes in Helotes proper frequently sit on quarter-acre to half-acre lots, with prices ranging from $320,000 to $550,000. The area has seen significant master-planned community development, including Alamo Ranch, which features homes across multiple price points and a range of builders. Commute times from Helotes into downtown San Antonio run approximately 30 to 45 minutes during peak hours depending on the route. For more detail on that commute, see the guide to commute times from Helotes into downtown San Antonio.
The South Side and Mission District
The south side of San Antonio, anchored by Mission Road and the four UNESCO World Heritage Spanish colonial missions, contains some of the city's most affordable single-family inventory. Homes in ZIP codes like 78221 and 78223 frequently list between $160,000 and $260,000, with a mix of post-World War II ranch homes and newer infill construction. The area has seen increased investor activity in recent years, and some blocks have undergone notable renovation. Mission Concepcion Park, Espada Park, and the Mission Reach section of the San Antonio River Greenway provide significant green space throughout the corridor.
The Northeast and Converse Area
The northeast quadrant, including Converse, Universal City, and Live Oak, sits adjacent to Randolph Air Force Base and Fort Sam Houston. This location makes it one of the more active corridors for military-connected buyers using VA financing. Homes in Converse and Universal City typically range from $210,000 to $330,000, with a mix of 1980s and 1990s brick ranch homes and newer subdivisions built in the 2010s and 2020s. IH-35 and Loop 1604 provide access to downtown San Antonio in roughly 25 to 35 minutes outside of peak congestion windows.
3. Timing the San Antonio Market as a Buyer or Seller
Timing in San Antonio follows recognizable seasonal patterns, though the market's current balance means those patterns matter less than they did when inventory was razor-thin. Both buyers and sellers benefit from understanding when the market is most active and when it tends to slow down.
When Sellers See the Most Activity
Spring listings in San Antonio, particularly those that go live between late February and early May, historically attract the most buyer traffic. Families with school-age children tend to begin their search early in the year so they can close and settle before August. Sellers who list in this window typically see more showings, faster offers, and stronger negotiating positions than those who list in late summer or fall. That said, September 2026 is not a dead zone for sellers. With inventory still elevated relative to 2021 levels, well-priced homes in move-in condition continue to attract serious buyers who missed out during the spring rush. For more on the selling process and timeline, see the guide to selling a home in San Antonio, Texas.
When Buyers Tend to Find More Leverage
Late summer and fall, roughly July through November, tend to give buyers more room to negotiate in San Antonio. Sellers who did not close during the spring window are often more open to price reductions, repair credits, and seller-paid closing costs by September. Right now, buyers in the $250,000 to $400,000 range are finding more options than they had in 2022 or 2023, and many are successfully negotiating concessions that were essentially impossible two years ago. The winter months of December and January see the lowest competition, which can work in a buyer's favor, though selection is also thinner.
How Interest Rates Are Shaping Decisions in 2026
Mortgage rates remain a central factor in buyer decision-making as of September 2026. Rates have come down from their 2023 peaks but have not returned to the sub-4% environment of 2020 and 2021. Most conventional 30-year fixed loans are pricing in the mid-to-upper 6% range, which affects monthly payments considerably at San Antonio's price points. A buyer purchasing a $300,000 home with 10% down at 6.75% is looking at a principal and interest payment of roughly $1,750 per month before taxes and insurance. Buyers who locked in rates during 2020 and 2021 are understandably reluctant to sell, which is one reason resale inventory has not fully normalized despite softer demand.
4. What Drives Home Prices in San Antonio
Price in San Antonio is not a single number; it is the result of several overlapping factors that shift block by block. Understanding what moves the needle helps buyers make smarter offers and helps sellers price accurately from the start.
Location and Proximity to Employment Corridors
San Antonio's major employment anchors pull prices upward in their surrounding areas. Joint Base San Antonio, which encompasses Lackland, Randolph, and Fort Sam Houston, employs tens of thousands of military and civilian personnel and drives steady demand in the northeast, northwest, and south sides. The South Texas Medical Center on the northwest side employs more than 35,000 people and creates sustained demand in a wide radius around it. Toyota's manufacturing plant on the far south side along IH-35 has similarly anchored residential demand in that corridor. Homes within a 15-minute drive of these employment centers tend to hold value more consistently than those farther out.
New Construction vs. Resale Dynamics
San Antonio has one of the most active new construction pipelines of any major Texas city, and that supply affects resale pricing directly. Builders in master-planned communities like Alamo Ranch, Verano, and Sommerset have been offering rate buydowns, upgraded appliance packages, and closing cost incentives to move inventory. Resale sellers in the same price range must compete with those incentives, which means pricing strategy and home presentation matter more than they did when buyers had no alternatives. For a full look at what is being built across the metro right now, the guide to new residential developments and master-planned communities in San Antonio in 2026 covers the active projects in detail.
Property Age, Lot Size and Condition
Older homes in San Antonio often carry larger lots and more architectural character than newer construction, but they also come with deferred maintenance risk. A 1960s ranch home in Shavano Park or Terrell Hills on a 12,000-square-foot lot might list at a similar price to a 2015 build in a northwest subdivision on a 6,000-square-foot lot, but the inspection outcomes and renovation needs will look very different. Buyers should budget for a thorough inspection and factor in the cost of updating HVAC systems, plumbing, and roofing when evaluating older properties. Sellers of older homes who make targeted improvements before listing, particularly roof, HVAC, and cosmetic updates, typically recover those costs in sale price and reduced negotiation.
National data confirms that home price appreciation has remained positive across most metro areas. According to the National Association of Realtors, more than 80% of metro areas posted home price increases in the first quarter of 2025, a trend that continued into 2026 at a more moderate pace. San Antonio fits within that broader pattern of modest appreciation rather than the sharp swings seen in more volatile markets.
5. Practical Steps for Buyers and Sellers in San Antonio Right Now
The current market rewards preparation on both sides of the transaction. Buyers who are pre-approved and clear on their priorities move faster when the right property appears. Sellers who price accurately from day one avoid the stigma of price reductions and extended days on market.
Steps for Buyers
Start with financing before touring homes. Get a full pre-approval letter, not just a pre-qualification, so you know your exact budget and can move quickly. Identify which areas of San Antonio match your commute tolerance, price range, and property type preference before scheduling tours. San Antonio is large, roughly 470 square miles, and driving across the city to tour homes that do not fit your criteria wastes time and creates decision fatigue. Once you identify target neighborhoods, track active listings and recent sales data so you recognize a well-priced home when you see one. If you are relocating from outside the area, the relocation guide for San Antonio covers costs and timelines in detail.
Factor in total monthly cost, not just purchase price. San Antonio property tax rates vary by municipality and special district. Homes inside city limits but outside a municipal utility district carry different tax burdens than homes in newer developments with MUD overlays, which can add $0.50 to $1.00 per $100 of assessed value on top of city and county rates. Homeowners association fees, flood zone considerations near Salado Creek and the San Antonio River, and homeowners insurance costs in Bexar County all affect your real monthly payment.
Steps for Sellers
Price your home based on closed sales, not active listings. Active listings represent seller aspirations; closed sales represent what buyers actually paid. In September 2026, the gap between list price and sale price in San Antonio has widened slightly compared to 2022, meaning overpriced homes are sitting. A comparative market analysis using homes that closed in the last 60 to 90 days within a half-mile radius and similar square footage is your most reliable pricing tool.
Presentation drives first impressions in a market with more inventory. Professional photography, a clean exterior, and a home that shows well on the first visit are not optional extras in the current environment. Buyers have choices, and they move past listings that look tired online before they ever schedule a showing. Decluttering, fresh paint in neutral tones, and addressing any deferred maintenance items before listing will consistently outperform homes that skip this step. If you are also considering downsizing as part of your next move, the downsizing guide for San Antonio covers options and costs in detail.
FAQ
What is the median home price in San Antonio, Texas right now?
As of September 2026, the median home price in the greater San Antonio metro ranges from approximately $295,000 to $320,000 depending on the specific submarket and property type. Inner-loop neighborhoods and established enclaves like Alamo Heights and Monte Vista carry medians well above that range, while the south side, northeast side, and outlying areas like Converse and Floresville offer entry points below $250,000. New construction in master-planned communities on the northwest and far west sides spans a wide range from the low $200,000s to over $500,000 depending on the builder and lot. Tracking closed sales rather than list prices gives the most accurate read on what homes are actually selling for in any given ZIP code.
Is San Antonio a buyer's market or a seller's market in September 2026?
San Antonio is operating close to a balanced market in September 2026, with roughly three to four months of housing supply across most price ranges. That is a significant shift from the extreme seller's market conditions of 2021 and 2022, when inventory was measured in weeks rather than months. In the entry-level range below $250,000, competition remains relatively stronger because supply is thinner and demand from first-time buyers and investors is consistent. In the $400,000 and above range, buyers have more options and more negotiating room than they have had in several years. Conditions vary enough by neighborhood and price band that working with a local agent who tracks the data weekly is essential to understanding where leverage actually sits.
Which parts of San Antonio have the most real estate activity right now?
The northwest corridor, including the Stone Oak area and the Medical Center vicinity, consistently sees the highest transaction volume in the San Antonio metro. The far west side around Helotes and Alamo Ranch is also active due to a large pipeline of new construction and strong demand from buyers seeking larger lots at lower price points than the inner loop. The northeast side around Converse and Universal City remains active due to proximity to Joint Base San Antonio. The inner loop neighborhoods like King William, Lavaca, and Monte Vista carry fewer total transactions but higher price points and strong buyer interest from people relocating from higher-cost cities. Each of these areas has distinct housing stock, price ranges, and commute profiles that make them suited to different buyer priorities.