
← Back to Blog
Market Trends
West Covina, CA Real Estate Market Guide: Prices, Neighborhoods and Timing
By Marisol Lucardie, REALTOR®
Coldwell Banker Leaders · DRE# 02223269
September 22, 2026 · 11 min read
If you are trying to make sense of the West Covina, CA real estate market guide covering prices, neighborhoods and timing, you are in the right place. This article pulls together current market data, a breakdown of what housing actually looks like across different parts of the city, and a clear-eyed look at when to move so you can make a confident decision whether you are buying, selling, or relocating.
1. How the West Covina Housing Market Stands Right Now
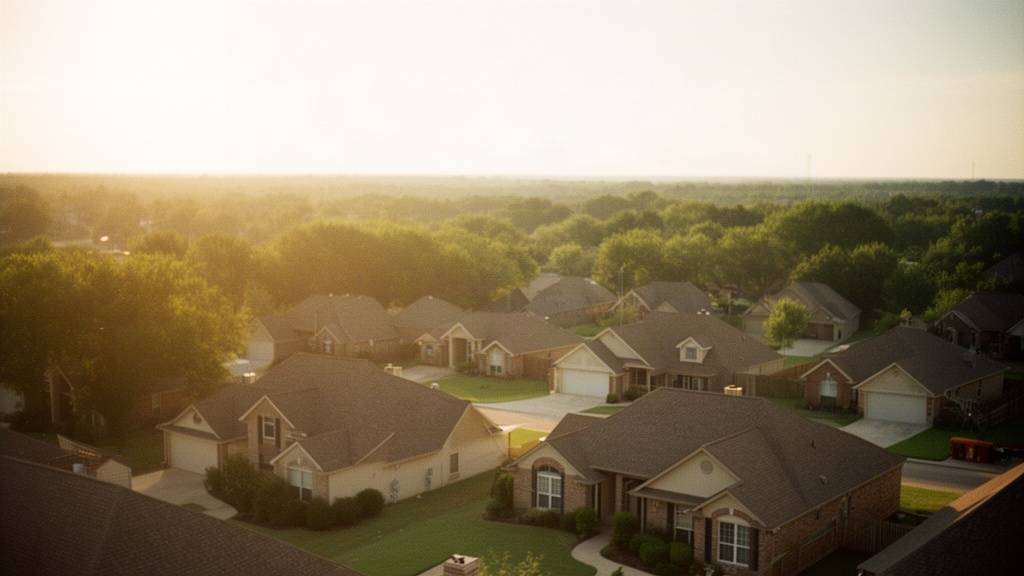
West Covina is a mid-sized city of roughly 110,000 residents sitting about 19 miles east of downtown Los Angeles in the eastern San Gabriel Valley. The housing market here has historically tracked slightly below the broader Los Angeles County median while offering more square footage, larger lots, and a higher share of single-family detached homes than most westside cities.
Where Prices Sit in September 2026
The median sale price for single-family homes in West Covina is currently in the high $700,000s to low $800,000s range, depending on the specific street, lot size, and condition. For a deeper look at exactly where the median landed this month, see the dedicated breakdown in What Is the Average Home Price in West Covina CA Right Now in September 2026. Condominiums and townhomes generally trade in the $450,000 to $600,000 range, making them the more accessible entry point for first-time buyers.
Price per square foot currently averages around $430 to $470 for single-family homes across the city, though updated homes in the northern hillside sections routinely push past $500 per square foot. Homes that need work or sit on busy arterials like Azusa Avenue or Garvey Avenue tend to price at the lower end of those ranges, giving buyers willing to renovate real room to build equity.
For current trend data and historical appreciation charts, Redfin's West Covina housing market page tracks median sale prices, months of supply, and sale-to-list ratios updated monthly. It is a useful baseline to check alongside local agent data.
How Inventory and Competition Have Shifted
Inventory in West Covina remains constrained. The city typically carries between two and three months of supply, which keeps the market tilted toward sellers even as mortgage rates have cooled some buyer enthusiasm compared to 2021 and 2022. The number of active listings in September 2026 is running below what you would expect for a city this size, partly because many homeowners locked into sub-4% mortgages during the pandemic years are reluctant to sell and take on a higher rate.
Well-priced, move-in-ready homes in West Covina are still receiving multiple offers and going under contract within one to two weeks. Homes that need cosmetic work or are priced aggressively above comparables are sitting longer, sometimes 30 to 60 days, which gives buyers in that segment more negotiating room than they would have had two years ago.
2. What Housing Actually Looks Like Across West Covina
West Covina is not one uniform housing market. The city covers about 16 square miles, and the character of the housing stock changes noticeably as you move from the flatter southern sections near the 10 freeway up into the hillside streets north of Workman Avenue. Understanding those differences helps buyers target the right area and helps sellers set realistic expectations.
North West Covina: Hillside Streets and Larger Lots
The northern portions of West Covina, particularly the streets that climb toward the Puente Hills and border Shadow Oak Park and Cortez Park, feature some of the city's largest lots and most varied architecture. You will find ranch-style homes from the 1960s and 1970s on 8,000 to 12,000 square-foot lots alongside Spanish Colonial and contemporary builds on parcels that occasionally exceed a quarter acre. Views of the San Gabriel Valley floor are common on the upper streets.
Prices in the northern hillside sections typically run $50,000 to $150,000 above the city median, reflecting lot premiums and the relative scarcity of turnover. A four-bedroom updated ranch on a corner lot in this part of West Covina can realistically list in the low to mid $900,000s. Buyers who prioritize outdoor space and a quieter street profile tend to focus their search here.
Central and South West Covina: Mid-Century Blocks and Walkable Corridors
The central core of West Covina, the neighborhoods surrounding West Covina Parkway, Sunset Avenue, and the area around West Covina High School, is dominated by post-war tract homes built between the late 1940s and mid-1960s. These are typically three-bedroom, one-and-a-half to two-bath homes on 6,000 to 7,500 square-foot lots. Many have been updated with modern kitchens and baths while retaining original hardwood floors and covered patios.
This central band of West Covina is also where you find the city's main commercial activity: the West Covina Mall area on Citrus Avenue, the Eastland Center, and the concentration of restaurants and shops along Vincent Avenue. Homes here price closer to the city median, often in the $720,000 to $800,000 range for a well-maintained three-bedroom. For more on the day-to-day experience of living in this part of the city, see What Is It Actually Like to Live in West Covina CA Day to Day.
The southern edge of West Covina, near the 10 freeway and the border with Covina and Baldwin Park, carries the city's most affordable single-family inventory. Smaller lots, some older infrastructure, and freeway proximity keep prices in the $650,000 to $730,000 range for comparable homes. That same freeway access is also a selling point for commuters headed west toward downtown Los Angeles.
East Side Near Azusa Avenue and the 605 Corridor
The eastern edge of West Covina runs along the 605 freeway and borders Irwindale and Baldwin Park. Housing here is a mix of original tract homes, some light industrial adjacency near Azusa Avenue, and a scattering of newer infill construction. Lot sizes are inconsistent, ranging from compact 5,500 square-foot parcels to occasional larger corner lots. Prices on the east side can be 5 to 10 percent below the city median, which attracts buyers who want more purchasing power and are comfortable with the 605 freeway as their primary north-south artery.
Condominiums and attached townhomes are concentrated along major corridors throughout the city rather than clustered in one district. Complexes near the West Covina Metrolink station on Sunset Avenue are particularly relevant for buyers who commute to Los Angeles Union Station, a roughly 35-minute rail trip from that stop.
3. What Drives Home Prices in West Covina
Several specific factors push West Covina home prices up or down from the baseline median. Knowing them helps buyers evaluate whether a listing is priced fairly and helps sellers understand what improvements or positioning will move the needle.
Lot Size, Condition, and Configuration
Lot size is one of the strongest price drivers in West Covina. A home on a 10,000 square-foot lot will reliably command a premium over an otherwise identical home on a 6,000 square-foot lot, often $40,000 to $80,000 more, because West Covina buyers value outdoor space, ADU potential, and room for pools and additions. The city's zoning allows accessory dwelling units on most single-family parcels, which has made larger lots even more attractive as a rental income play.
Condition and kitchen-bath updates are the second biggest lever. A three-bedroom home with an original 1960s kitchen and single bathroom will sit $80,000 to $120,000 below a comparable home that has been fully renovated, even on the same street. Buyers willing to take on a cosmetic project can find meaningful value in West Covina's older inventory, but they need to factor in contractor costs, which remain elevated across the Los Angeles metro area in 2026.
Proximity to Freeways and Transit
West Covina sits at the intersection of the 10 and 605 freeways, and freeway access is a significant pricing variable. Homes within a quarter mile of an on-ramp tend to trade at a discount because of noise and air quality, while homes that are close enough to use the freeway easily but far enough to avoid the noise corridor hold their value well. The sweet spot for most buyers is three to six blocks from a major on-ramp.
The West Covina Metrolink station provides rail service to Union Station in roughly 35 minutes during off-peak hours, and homes within a walkable distance of the station carry a modest transit premium. For a detailed look at how different parts of the city compare on commute time and freeway access, see What Neighborhoods in West Covina CA Are Close to the 10 Freeway for an Easy Commute to Downtown LA.
The Regional San Gabriel Valley Context
West Covina prices do not move in isolation. The city competes directly with neighboring Covina to the west, Glendora to the north, and Baldwin Park and Azusa to the east and northeast. When Covina or Glendora inventory tightens, buyers spill into West Covina and push prices up. When the broader Los Angeles market softens, West Covina typically follows with a lag of one to two months.
PropertyShark tracks residential sales data across West Covina and the surrounding San Gabriel Valley cities, and their West Covina market trends page shows quarterly sale counts and median price movement going back several years. Comparing West Covina's trajectory against neighboring cities is a useful exercise before making an offer or setting a list price.
4. Timing the West Covina Market as a Buyer or Seller
Timing matters in any real estate market, but it matters differently depending on which side of the transaction you are on. West Covina follows a seasonal pattern that is broadly similar to the rest of Southern California, with some local nuances worth knowing.
What Buyers Gain by Acting in Fall 2026
September through November is historically the second-best window for buyers in West Covina. Spring brings the most listings but also the most competition. Fall brings fewer listings but also fewer competing buyers, which means sellers are often more willing to negotiate on price, credits, or contingency timelines. Homes that did not sell during the spring and summer are re-listed or re-priced in September, creating opportunities for buyers who were priced out or outbid earlier in the year.
Buyers relocating to West Covina from out of the area should also account for the time needed to research the city's different housing pockets. West Covina's 16 square miles contain meaningful variation in lot size, architecture, and price, and spending a weekend driving the streets north of Workman Avenue versus the blocks near the 10 freeway will sharpen your sense of value quickly.
For buyers who are also weighing how to handle an existing home sale before purchasing, see the related discussion in Is Fall 2026 a Good Time to Sell a Home in West Covina CA or Should I Wait Until Spring, which covers the seller-side timing question in detail.
What Sellers Should Know About Listing Windows
West Covina sellers have historically seen the strongest sale prices in March through June, when buyer demand peaks and multiple-offer situations are most common. A well-prepared home listed in late March or early April in West Covina will typically attract more showings and higher offers than the same home listed in August or January. That said, the fall window is not a bad time to sell if your home is priced correctly and in move-in condition, because the buyers who are active in September and October tend to be motivated and pre-approved.
Sellers should also pay attention to how quickly comparable homes are moving before setting a list price. In September 2026, homes in West Covina that are priced within 2 to 3 percent of their true market value are going under contract in under 20 days. Homes priced more than 5 percent above comparables are sitting 45 days or longer and often end up selling below what a correctly priced listing would have achieved. Overpricing in a constrained-inventory market is a common mistake that costs sellers both time and money.
If you are considering listing and want to explore your options in more detail, the Homes for Sale in West Covina CA Guide covers what the current active inventory looks like and what buyers are competing for right now.
5. Key Numbers to Anchor Your West Covina Market Research
A West Covina real estate market guide is only as useful as the numbers behind it. The figures below reflect conditions as of September 2026 and are intended as a working reference, not a substitute for a comparative market analysis on a specific property.
- Median single-family sale price: High $700,000s to low $800,000s depending on area and condition as of September 2026.
- Median condo and townhome price: Approximately $450,000 to $600,000, with newer complexes near the Metrolink station at the higher end.
- Price per square foot: Roughly $430 to $470 citywide for single-family homes; updated hillside homes can exceed $500 per square foot.
- Months of supply: Approximately two to three months, indicating a seller-leaning market with limited inventory.
- Typical days on market: Under 20 days for correctly priced, move-in-ready homes; 45 or more days for overpriced or deferred-maintenance properties.
- Lot size range: Most single-family lots fall between 5,500 and 12,000 square feet; hillside parcels occasionally exceed a quarter acre.
- Commute to downtown LA: Approximately 35 to 50 minutes by car on the 10 freeway during off-peak hours; roughly 35 minutes by Metrolink from the West Covina station to Union Station.
- ADU potential: Most single-family parcels in West Covina qualify for an accessory dwelling unit under current California and city zoning rules, adding income potential for larger-lot buyers.
These numbers give you a framework, but the West Covina real estate market guide that actually helps you win a deal or price your home correctly has to be built around specific comparables on your target street. Broad medians can mask a $100,000 difference between two homes three blocks apart.
FAQ
Is West Covina a buyer's market or a seller's market right now?
As of September 2026, West Covina leans toward sellers. The city is carrying roughly two to three months of supply, which is below the four to six months that would indicate a balanced market. Well-priced, move-in-ready homes are still receiving multiple offers and going under contract in under three weeks. That said, the market is less aggressive than it was in 2021 and 2022, and buyers have more leverage on homes that need work or have been sitting for more than 30 days. A local agent can identify which specific listings have the most negotiating room.
What is the price difference between the north and south parts of West Covina?
The northern hillside sections of West Covina, particularly the streets near Cortez Park and Shadow Oak Park, typically price $50,000 to $150,000 above the city median because of larger lots, more varied architecture, and valley views. The southern sections near the 10 freeway tend to price 5 to 10 percent below the city median, reflecting smaller lots and freeway proximity. The central core of the city, around West Covina Parkway and Sunset Avenue, clusters closest to the median. These are approximate ranges and individual homes vary significantly based on condition, updates, and exact location.
How do I research schools in West Covina before buying?
West Covina is served by multiple school districts including the West Covina Unified School District and portions of the Covina-Valley Unified School District, depending on the specific address. Because school assignment is tied to parcel address rather than general neighborhood, the most reliable approach is to look up a specific property's address directly through the relevant district's enrollment office or the California Department of Education's school locator tool. For a full breakdown of which districts serve which parts of the city, see the dedicated article on elementary and middle schools in West Covina on this site. School research is a personal decision and every buyer's priorities differ, so reviewing district data directly is the recommended starting point.